
Ephemres (formerly LNMP)
From LNMP to Ephemres: What Changed Between v3.0 and v3.3.5
LNMP is now Ephemres. What changed from v3.0 to v3.3.5: NetFlow and IPFIX telemetry, a near zero-dependency Python core, and dashboards that stopped guessing.
When I wrote up LNMP v3.0 in September, two of the parts I was proud of were the typed SQLAlchemy repositories and the optional Redis storage driver. Neither is in the codebase any more. The project isn’t called LNMP either. It’s now Ephemres, at version 3.3.5.
I stopped writing a post per release because the releases outran the posts. Between the v3.0 merge on 1 September and the v3.3.5 branch at the end of October there were 256 commits and eleven releases. So this is one post for all of it. It covers what changed, why, and which parts of the v3.0 write-up no longer describe the code. If you copied anything from that post, start with the corrections section.
In short, five things changed since v3.0:
- Passive flow telemetry. Ephemres now collects NetFlow v5, NetFlow v9 and IPFIX alongside its ICMP and synthetic probes.
- A new name, with a migration path for existing installs.
- A near zero-dependency core. Thirteen runtime libraries are gone. What’s left is the Python standard library plus
uvicorn(with itshttptoolsparser anduvloopevent loop) andasyncpg. - Honest numbers. Several dashboard figures were estimates shown as measurements, and they’ve been fixed.
- Flows as routing evidence. The routers’ own flow records now confirm, question or fill in the topology that traceroute draws.
Why “Ephemres”
LNMP started as a pet project. I never meant to take it this far, and I half expected it to end up as one more repository I could point to and say “yeah, I did that”. That isn’t where it ended up. It now runs in a live environment, and it has pulled me into separate research on ICMP measurement (more on that below). A project like that needs a name it can keep. I didn’t want to tread on anyone else’s intellectual property, or face a forced rename later, so I chose a new one now.
In astronomy, an ephemeris is a table of where objects in the sky are at regular intervals. Ephemres’s TimescaleDB backend does the same thing for a network: link state, latency and loss recorded at fixed intervals over time. It’s a network ephemeris, more or less. The ending comes from diaeresis, from the Greek for separation, which I took to mean distinct.
What Changed Since v3.0, at a Glance
| Area | v3.0 (September 2026) | v3.3.5 (October 2026) |
|---|---|---|
| Telemetry | Active only: ICMP, TCP, HTTP, TLS expiry | Active plus passive NetFlow v5/v9 and IPFIX |
| Web framework | FastAPI and Pydantic | In-house ASGI router and schema engine |
| Database access | SQLAlchemy 2.0 repositories, Alembic | In-house async ORM and migrator over asyncpg |
| Fast storage | Optional Redis driver | FastStore: SQLite in WAL mode on a RAM-backed path |
| Probe scheduling | Random 0 to 2,000 ms start-up jitter | Fixed per-endpoint second slot derived from the UUID |
| Runtime dependencies | 15 packages | 4 named (6 installed, pinned and hash-checked) |
| Dashboard figures | Several defaults shown as measurements | Unknown values shown as unknown |
| Topology | Traceroute only | Traceroute checked against routers’ flow records |
| Alerting | No outbound notifications | Teams, Slack, Discord, webhooks and SMTP (v3.1.0) |
| Install layout | /opt/netmon, netmon-* units | /opt/ephemres, ephemres-* units |
Corrections to the v3.0 Post
Three things in part 4 no longer hold. One of them didn’t fully hold at the time either.
The sweep budget. Part 4 described a 32 second probe window with a 1.0 s socket timeout. The arithmetic only works when replies come back quickly. Each of the five probes can wait up to the full timeout, and there are four 8 s gaps between them, so the worst case at the time was:
The timeout is now 2.0 s, so the worst case is computed explicitly in monitoring/engine.py:
That still leaves room inside the 60 s cycle. But 32 s was the typical case, not the ceiling, and I should have said so.
The jitter. The 0 to 2,000 ms random start-up delay is gone (since 3.1.28s). Each endpoint now gets a fixed second within the minute, derived from its UUID:
def _stagger_offset_for_endpoint(endpoint_id: UUID) -> int:
    """Computes deterministic second-slot offset (0-59s) based on endpoint UUID."""
    return int.from_bytes(endpoint_id.bytes[:4], "big") % 60
Random jitter only smoothed the first two seconds of each minute, so a hundred endpoints still fired within a two-second window. A slot derived from the UUID spreads them across all sixty seconds, and each endpoint keeps the same slot every cycle. That makes per-endpoint timing comparable from one cycle to the next.
The SSRF check. Part 4’s HTTP probe blocked requests by looking for 169.254.169.254 or 127.0.0.1 in the URL string. That’s easy to get round: a hostname that resolves to the metadata address passes straight through. Since 3.1.1s and 3.1.28s, the probe resolves the name first, checks the resulting address against private, loopback, link-local and CGNAT ranges, and then pins the connection to that checked address so a second DNS answer can’t swap it. Redirects aren’t followed automatically. The OWASP SSRF Prevention Cheat Sheet describes this approach, and it’s what the part 4 snippet should have done.
Adding Passive Flow Telemetry (v3.2.0 to v3.3.0)
ICMP tells you a device answers. It doesn’t tell you what traffic is passing through it, which is usually the next question when a link feels slow. From v3.2.0, Ephemres collects flow records exported by the routers themselves: NetFlow v5, NetFlow v9 (RFC 3954) and IPFIX (RFC 7011).
Collection runs in its own daemon, ephemres-flowd, separate from the probe engine and the API. It listens on UDP 2055 for NetFlow and UDP 4739 for IPFIX, asks the kernel for a 4 MB receive buffer, and decodes packets with struct.unpack_from straight from the receive buffer. On a stock Ubuntu install the kernel caps that request at 212,992 bytes (net.core.rmem_max), so the installer raises the cap with /etc/sysctl.d/90-ephemres.conf. With the small buffer, 1.5 % of flows were dropped at 10,000 flows a second. Because v9 and IPFIX send their templates separately from the data, records whose template hasn’t arrived yet are held in a small buffer until it does. ephemres-flowd then hands the decoded records straight to its aggregator, which rolls them into one-minute TimescaleDB rows, and continuous aggregates roll those up into hourly and daily tables. Flows don’t pass through FastStore.
Two design decisions matter more than the parsing.
Ports. A flow table keyed by source and destination port is mostly client ephemeral ports, and each one becomes a new row and a new index entry. Ephemres keeps the service side of the conversation and drops the client’s random port:
def normalize_service_port(src_port: int, dst_port: int, protocol: int = 0) -> int:
    if protocol in (1, 58):          # ICMP and ICMPv6 have no ports
        return 0
    if 0 < dst_port < 1024 or dst_port in KNOWN_SERVICE_PORTS:
        return dst_port
    if 0 < src_port < 1024 or src_port in KNOWN_SERVICE_PORTS:
        return src_port
    if 0 < src_port < 10000 and dst_port >= 10000:
        return src_port
    return dst_port
KNOWN_SERVICE_PORTS holds the registered ports that matter on a typical network (3306, 5432, 6443, 8443, 51820 and so on). The heuristic is imperfect. A service on an unusual high port can still be misread. But without it, row counts grow with the number of client connections rather than the number of services.
Device roles. A router that only exports flows may not answer ping at all, and counting it as down was wrong. Endpoints now have a role (ACTIVE_HOST, FLOW_EXPORTER, HYBRID_GATEWAY, L2_SWITCH). A pure exporter is passive: Ephemres doesn’t probe it, and it doesn’t count towards fleet uptime.
v3.3.0 added per-interface telemetry on top: the exporter’s interface indices mapped to names and configured link speeds, with utilisation calculated against those speeds.
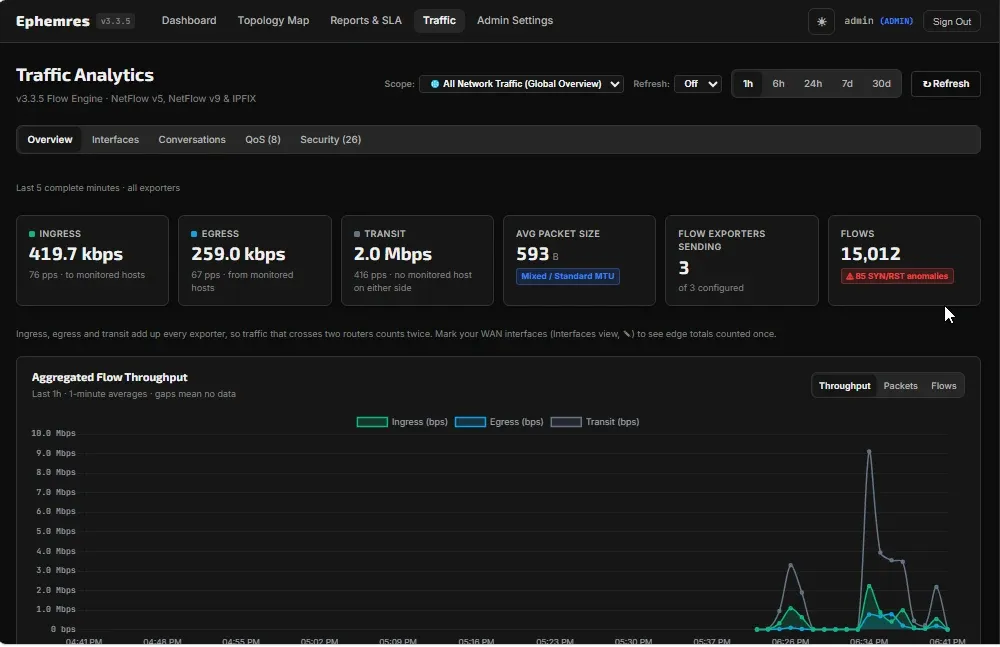
The Traffic Analytics overview in my lab: three exporters, the last five complete minutes. The note under the tiles comes up again in the “honest numbers” section.
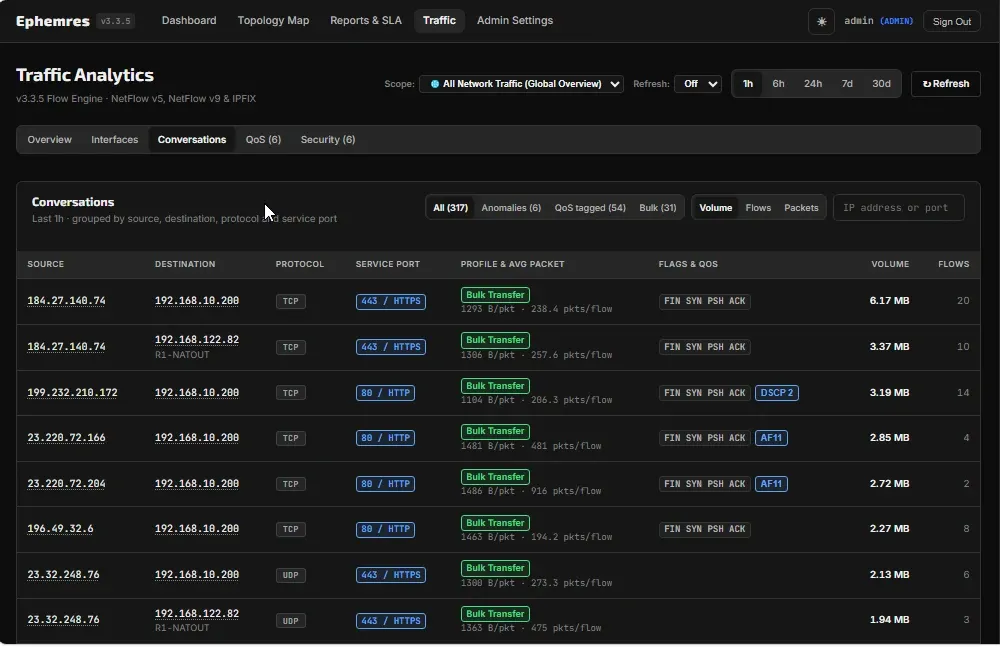
Conversations, grouped by source, destination, protocol and the normalised service port. The flags column comes from the TCP flags field the exporters send, and the QoS column from the DSCP bits.
The Rename
Most of the rename is operational. /opt/netmon became /opt/ephemres, the netmon-* services became ephemres-api, ephemres-engine and ephemres-flowd, and configuration moved to /etc/ephemres. NETMON_ environment variables are still read as a fallback. The database is still called netmon, deliberately, so that restores across versions keep working.
One part needed more care than find-and-replace. Ephemres encrypts alert channel secrets at rest (SMTP passwords, webhook URLs) with AES-256-GCM, using a key derived with HKDF from a salt that had “lnmp” in it. Change the salt and every stored secret becomes unreadable. New secrets now use an Ephemres salt, and the old one is still tried when decrypting. Renaming software that encrypts its own data turns out to be partly a key-management job.
Vertical Integration: Removing Thirteen Dependencies (v3.3.2.v)
This is the change I expect people to disagree with, so here is the reasoning in full.
As Ephemres grew, every new feature started the same way: find a library that does it, install it, use it. Each one made installs longer and brought in far more code than the feature needed. Over time that added complexity rather than removing it. The last straw was PDF reporting. WeasyPrint needs Pango and HarfBuzz as system libraries, and a server missing one of them failed at runtime with OSError: cannot load library 'pango-1.0-0'. That ended the “just find a library” approach.
In v3.3.2.v I removed thirteen runtime packages and wrote what Ephemres actually used of each, in backend/app/core/:
| Removed | Replaced by | Lines of code |
|---|---|---|
fastapi, starlette | asgi.py: ASGI 3.0 router, dependency injection, middleware, SSE | 1,834 |
sqlalchemy | orm.py: async query compiler and unit of work over asyncpg | 2,234 |
pydantic | schema.py: validation, type coercion, serialisation | 879 |
alembic, psycopg2-binary | migrator.py: migrations applied over asyncpg | 529 |
redis | faststore.py: SQLite-backed store with a Redis-style API | 1,230 |
httpx | http_client.py: socket-level HTTP client with SSRF checks | 499 |
weasyprint, pypdf | pdf.py: writes PDF directly (plus pdf_fonts.py, 138, and pdf_ttf.py, 216) | 1,707 |
jinja2 | template.py: the template subset Ephemres uses | 399 |
psutil | netlink.py plus /proc readers | 97 |
argon2-cffi | hashlib.scrypt with constant-time comparison |
The core is about 11,500 lines of code. backend/requirements.txt now has four entries:
uvicorn==0.52.0
httptools==0.9.0
uvloop==0.23.0
asyncpg==0.31.0
Servers install backend/requirements.lock instead: six packages (those four plus uvicorn’s click and h11), every one pinned with its file hashes and installed with pip install --require-hashes.
What “zero-dependency” doesn’t mean
The README calls it zero-dependency, which isn’t quite true. Ephemres still needs uvicorn to serve HTTP (with httptools to parse it and uvloop as the event loop), asyncpg to talk to PostgreSQL, and PostgreSQL with TimescaleDB itself. AES-256-GCM comes from OpenSSL’s libcrypto, loaded through ctypes, because the standard library has no AES implementation. Four named packages, six installed, all pinned with hashes, is the accurate claim.
Passwords are hashed with scrypt at , , . That matches the minimum the OWASP Password Storage Cheat Sheet gives for scrypt, using parameters as defined in RFC 7914. Accounts restored from older backups still carry Argon2id hashes, which the standard library can’t verify. Those accounts are given a temporary password and must change it at the next login.
FastStore, and what it forgets
FastStore replaced Redis. It’s SQLite in WAL mode with synchronous=OFF, stored in /run/ephemres (a systemd runtime directory on tmpfs), or in /dev/shm if that isn’t available. It exposes the subset of the Redis API Ephemres used: keys with expiry, sets, sorted sets, streams with consumer groups, and pub/sub between processes.
The trade-off is deliberate, but it should be stated plainly: FastStore lives in RAM, and a reboot clears it. synchronous=OFF gives up durability on power loss, as the SQLite documentation warns. On a RAM-backed path there was never any durability to give up. After a reboot, the list of unregistered exporters starts again from empty.
FastStore carries live events and caches only. Everything that matters (sessions and sign-in lockouts, probe results, the event history, flow rollups, settings) lives in PostgreSQL. I’m comfortable with that split. It does mean “Redis replacement” should be read as “replacement for how Ephemres used Redis”, not as a general one.
What it cost
Writing your own framework means owning its bugs. The day after the rewrite merged, a review produced 33 numbered fixes, committed one by one on 18 October. The worst three were:
- 0.1 Alert dispatcher never becomes leader. Alerting silently did nothing.
- 0.2 Failed requests commit partial DB writes. A request that raised an error halfway through could leave half its changes in the database.
- 0.3 Legacy Argon2 password hashes can’t log in.
Most of the rest were the kind of thing a mature framework handled years ago: HEAD requests returning a body, CORS preflight checks, response cookies accepting control characters, LIMIT and OFFSET values interpolated instead of bound. I knew going in that I’d be taking on the security of an HTTP layer and an ORM along with the extra lines of code. I took that trade-off knowingly, and the review showed what it costs in practice.
There was more evidence of the same cost. A coverage run showed that about a quarter of the core had never run in a test. 360 lines of code that nothing called were deleted rather than tested. The new tests found that an empty POST to the sign-in route crashed with a 500 instead of answering 422. A dev-only comparison against the real Pydantic and SQLAlchemy (they never reach the servers) found seven quiet differences, all now fixed. And on Python 3.14, which the installer picks first, models lost all their fields until the core learned to read 3.14’s lazily evaluated annotations.
What it bought
I measured v3.3.0 (FastAPI, SQLAlchemy, Pydantic) against the v3.3.5 branch side by side on the same machine. Both ran on Python 3.12, each with its own migrated TimescaleDB database, under uvicorn with two workers as the systemd unit starts them, with 1,800 requests per run and several runs per test:
| Measure | v3.3.0 | v3.3.5 |
|---|---|---|
| Memory per worker after the request load | 155 MB | 47 MB |
| Import time of the application code | 2.0 s | 0.39 s |
| Whole process, import only | 2.4 to 2.8 s | 0.45 s |
| Launch until health checks answer (2 workers) | 2.1 to 2.4 s | 1.0 to 1.7 s |
The figures moved between a VM and bare metal, so treat these as typical values rather than best runs. Memory fell by about 70 % and import time about fivefold. Time to serving roughly halved, not more, because opening the database pool and starting the workers doesn’t get faster when you remove libraries.
Measuring the Measurer
A separate question ran alongside all this. A plain terminal ping and Ephemres, on the same host and probing the same targets, didn’t quite agree. Ephemres reported slightly higher RTTs and more jitter. I built a separate lab to find out why, and wrote it up in The Observer in the Loop.
The short version: under Ephemres’s real staggered schedule, the end-of-cycle database work I suspected (modelled on the old Pydantic and SQLAlchemy path) added nothing measurable to the reported RTTs. Most of the gap was Python’s own path from socket to timestamp, about 100 µs at the median, against about 70 µs for equivalent Go and Rust engines. The semaphore change I had been sure improved accuracy turned out not to be the cause.
The lab came after the rewrite, not before, so it didn’t drive any of the decisions above. It does change how I think about the obvious next step. Rewriting the probe engine in Go or Rust would buy roughly 30 µs under normal load. That isn’t a reason to change languages. Nothing in Ephemres has changed because of the lab yet. The lead I’d follow is taking the receive timestamp from the kernel (SO_TIMESTAMPING) instead of from Python, which removes that read delay in any language. That remains untested inside Ephemres.
Making the Numbers Honest (v3.3.5)
The lab’s lesson, measure before you believe, applied to the dashboards too. The dashboard rework that shipped in 3.3.5 started from an uncomfortable list: several numbers on screen looked like measurements but weren’t.
- Transit traffic split 50/50. Traffic with no monitored endpoint on either side was divided evenly between “ingress” and “egress”, inflating both.
- A 1 Gbps link speed assumed when none was configured, so utilisation percentages were made up for any interface nobody had set up.
- Flow exporters counted in fleet uptime, even though Ephemres doesn’t probe them.
- “Last Seen” was actually the time the endpoint entered its current state.
- The mean uptime calculation:
// Before
const totalSla = endpoints.value.reduce(
  (sum, ep) => sum + (parseFloat(ep.uptime_percentage_24h) || 100.0), 0)
parseFloat("0") is 0, which JavaScript treats as false, so an endpoint with 0 % uptime counted as 100 %. So did one with no data at all. The replacement treats missing as missing:
// After (utils/endpointState.js)
export function uptimeValue(ep, field = 'uptime_percentage_24h') {
  if (!isMonitored(ep)) return null
  const raw = ep?.[field]
  if (raw === null || raw === undefined || raw === '') return null
  const value = Number.parseFloat(raw)
  return Number.isNaN(value) ? null : value
}
Endpoints without a value are left out of the mean. If none have one, the dashboard shows nothing rather than 100 %. Passive, paused and not-yet-probed endpoints get their own “No status” tile instead of being counted as up, and unconfigured link speeds show “Not set” rather than a percentage.
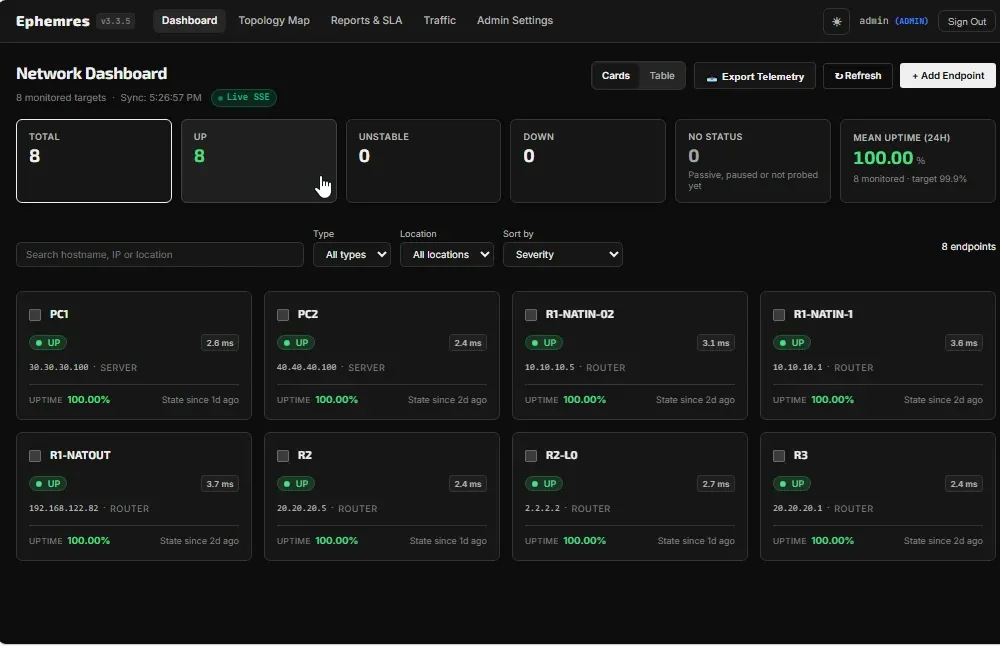
The dashboard after the fix. “No status” is its own tile, and each card says “State since” rather than “Last Seen”.
How these were fixed mattered as much as the fixes. Before changing anything, I wrote characterisation tests that pinned the existing behaviour, wrong numbers included, against a hand-computed dataset in a real TimescaleDB instance. Each later change then showed up as a deliberate test change rather than an accident. The maths behind rates, utilisation, DSCP classes and TCP anomalies was also moved into one module, flow_metrics.py, because the dashboard and the PDF report had each kept their own copy and the two had started to disagree.
The documentation got the same treatment. On 21 October, four commits checked the docs against the code and fixed what didn’t match: factual errors, contradictory install requirements, and overstated security and retention claims. The changelog still has more confident language in it than I’d write today.
Flows as Routing Evidence (v3.3.5)
This is the part of v3.3.5 I find most interesting as a network engineer. A router’s flow record says more than how many bytes moved. It can also say where the router sent them: the egress interface and, if the template includes it, the next hop. NetFlow v5 always carries a next-hop field. In v9 and IPFIX it is field 15 for IPv4 and 62 for IPv6 (ipNextHopIPv4Address and ipNextHopIPv6Address in the IANA IPFIX registry). Ephemres now decodes those fields and records, for each monitored endpoint, which path each exporter is actually using.
Detecting a route change without crying wolf
The obvious detector, “alert when the next hop changes”, fails on any network with equal-cost multipath, where traffic is shared across several next hops by design (RFC 2992 covers the hashing behaviour). monitoring/flow/path_tracker.py works per exporter, endpoint and direction, on each minute’s traffic as it arrives:
- The dominant path for a minute is the (egress interface, next hop) pair carrying the most bytes.
- Any path carrying at least of the minute’s bytes is significant.
- If two or more paths stay significant for consecutive minutes, that’s load balancing. Ephemres learns the set and never reports it as a change.
- A change is reported only when a new path has been dominant for minutes and the old path has fallen below .
A route switch rarely lands exactly on a minute boundary, so the minute it happens usually looks briefly like a split. The tracker counts that minute towards the new path rather than towards load balancing. Both and can be set in [flow] (route_ecmp_share, route_change_minutes). Minutes are counted by arrival time, not flow start time, because exporters report long flows late and a minute measured by flow start time is never really complete.
What a change triggers
A detected change publishes a ROUTE_HINT event. The API (one worker only) queues a traceroute to that endpoint, limited to one per endpoint every 15 minutes and ten per minute overall, so a core link failing over doesn’t set off hundreds of traceroutes at once. Previously a changed route showed up whenever the next traceroute happened to run. Now the routers’ own traffic records prompt one within a few minutes.
Checking traceroute against traffic
Every five minutes, each link on the topology map that traceroute drew is compared against flow records from the router at its upstream end:
- confirmed: that router’s recent traffic for the endpoint goes to the next hop traceroute showed;
- differs: traceroute shows one next hop, and the traffic goes to another;
- inferred: traceroute got no answer from the hop (
* * *), but the router’s flows name its next hop, so the silent hop can be labelled.
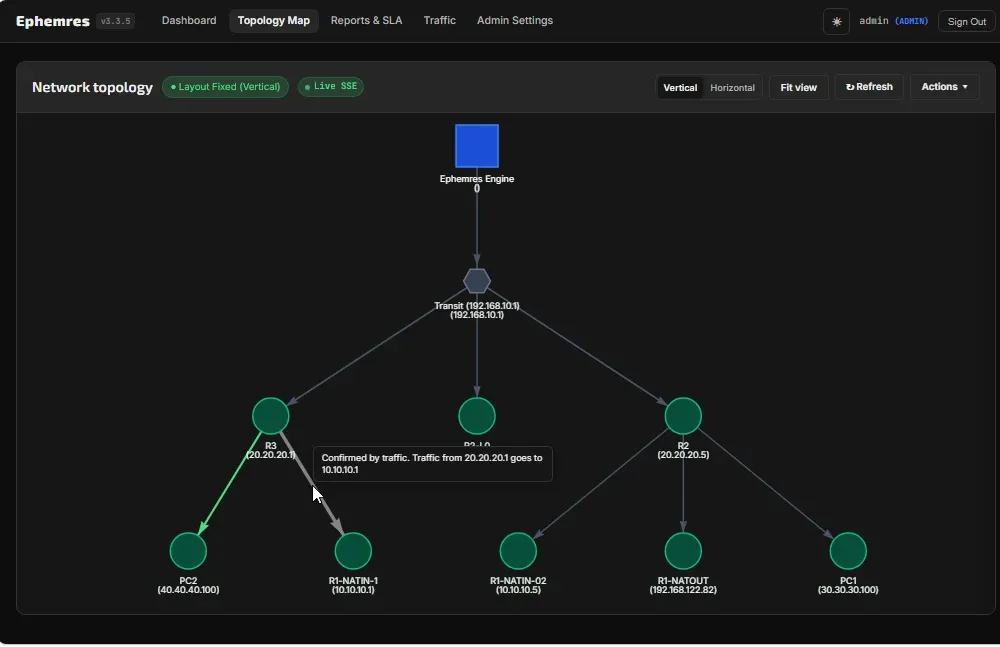
A confirmed link in my lab. R3 (20.20.20.1) exports flows, and its records show traffic for R1-NATIN-1 leaving towards 10.10.10.1, which matches what traceroute drew.
A traceroute shows the address a router answered from, usually its ingress interface. So a hop only matches an exporter if that address is the exporter’s primary IP or one of its listed export addresses. Links with no matching exporter are left unclassified rather than guessed.
Flow evidence in root-cause analysis
When an endpoint goes down, the RCA record now stores a snapshot of what the routers’ flows showed around the time probes started failing. If traffic to and from the endpoint kept flowing while ICMP failed, the likelier explanation is that something on the probe path is dropping ICMP, not that the endpoint is unreachable. I think that’s the most useful question v3.3.5 answers during an incident. The opposite isn’t as strong: no traffic is weaker evidence than traffic, because an exporter can report a flow up to its active timeout late.
I’ve simulated route changes in GNS3, and the detector and the evidence snapshot are also covered by unit tests and by integration tests against a real TimescaleDB instance. A simulation isn’t the real test, though. That comes when Ephemres faces a production network with real failovers and real ICMP filtering, and I’ll add that output here when I have it.
Counting the edge once
Summing traffic across every exporter counts a transfer once for each router it crosses: a branch-to-HQ transfer seen by both routers counts twice. The overview now says so on screen. The fix is a role on each interface. Mark the WAN interfaces, and v3.3.5 also reports network edge totals: traffic summed only where it enters or leaves the network, so each packet counts once.
Probe history, briefly
Each probe cycle now records its minimum, maximum and jitter as well as the average, in a hypertable that rolls up into an hourly continuous aggregate. That’s what powers the 24-hour loss, p95 RTT and jitter on the dashboard. One small failure is worth mentioning. The aggregates’ refresh windows only reached back three days (seven for the daily view), so if the scheduler stopped for longer than that, the gap was never filled in, even though the raw data was still there. Migration 0018 widened the windows to 29 and 60 days, within each table’s retention period.
Upgrading a netmon Install to Ephemres
First, which versions can upgrade:
- v3.2.0 and later: tested. These installs use the netmon layout, and the steps below move them to Ephemres.
- Anything older, including v3.0.0 (the version in part 4): not tested. It may work, but I haven’t verified it, so I can’t recommend it. If you try, take your own database backup first and treat it as an experiment.
Ephemres 3.3.5 needs Python 3.11 or newer. A netmon-layout install doesn’t have /opt/ephemres/deploy/upgrade.sh yet, so clone v3.3.5 and run its script:
git clone --branch v3.3.5 https://github.com/dc8official/ephemres.git ~/ephemres
sudo bash ~/ephemres/deploy/upgrade.sh
The script detects the old layout (/etc/netmon/netmon.env present, no /etc/ephemres/ephemres.env) and, after taking a database backup:
- creates the
ephemresuser and/etc/ephemres/ephemres.env, writing eachNETMON_*value asEPHEMRES_*, so the database password and the alert-secret key carry over; - builds a new virtualenv at
/opt/ephemres/venv, installs the hash-checked package lock, removes packages Ephemres doesn’t use, and migrates the database; - disables the
netmon-*services and points the existing nginx site at/opt/ephemres, keeping the original asnetmon.pre-ephemres; - starts
ephemres-api,ephemres-engineand, if flow collection was enabled,ephemres-flowd.
It also turns off TimescaleDB’s telemetry report to Timescale. /opt/netmon, /etc/netmon and the disabled units are left in place, so a rollback means re-enabling the old services and restoring the pre-upgrade backup.
Earlier versions of this script could report success while the platform stayed down, because the new services pointed at a virtualenv and env file that didn’t exist yet. The last step now checks for that. It stops with UPGRADE INCOMPLETE and exit code 1 unless the services are running and the API answers its health check within about a minute. Since 26 October, the backup and restore scripts also refuse to purge anything without a verified backup, and they keep the encryption key alongside the backup it belongs to.
Verifying the upgrade
These are the checks I’d run afterwards. The commands are standard. What you see will depend on your install.
# Services up (ephemres-flowd only if flow collection is enabled)
systemctl is-active ephemres-api ephemres-engine ephemres-flowd

# API answers locally
curl -fsS http://127.0.0.1:8000/api/v1/health

# Flow collector listening on NetFlow and IPFIX ports
sudo ss -ulpn | grep -E ':(2055|4739)\b'

# Old units disabled
systemctl is-enabled netmon-api netmon-engine 2>/dev/null
Then, in the browser: the header shows v3.3.5, the dashboard shows the green “Live SSE” badge, and the Traffic page counts your exporters under “Flow exporters sending”. If an exporter appears under unregistered sources instead, add its export address to the device rather than creating a new endpoint for it.
Where It Stands
Some things feel settled. Probes and flows together answer questions neither can alone. The dashboards no longer present defaults as measurements. The install is smaller and starts faster, by the amounts measured above.
Other things still rub. I now maintain about 11,500 lines of framework code. It’s about 80 % covered by tests and checked against the libraries it imitates, but the 33-fix review is a fair indication of how many surprises that can hold. FastStore forgets everything at reboot. It holds only live events and caches, so a reboot costs nothing that matters, but it still needs saying every time someone calls it a Redis replacement. Ephemres is still a single-host design. The flow-based route detection works in tests and in a GNS3 simulation, but it hasn’t faced a real failover on a production network yet. And there’s the roughly 100 µs that Python adds to every RTT, with a kernel-timestamp fix I’ve only tested outside Ephemres.
The code is at github.com/dc8official/ephemres. The old lnmp repository URL redirects there, so links from earlier parts of this series still work. The changelog has the release-by-release detail this post leaves out.
Kenneth Nnorom Website: kennethnnorom.com | LinkedIn: linkedin.com/in/kennethnnorom